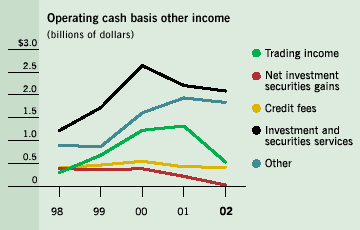
Other income
Other income represents all of our income other than net interest income. Sources of other income include revenues from trading activities, brokerage fees, mutual fund management fees, service fees, income from securitized loans and other revenue.
See supplementary information pages 36 and 37, tables 5 and 6
(pdf)
Other income was $4,889 million in 2002, a decrease of $1,208 million or 20% from 2001, after excluding special gains from the sale of the Bank’s mutual fund record keeping and custody business in 2002 and special gains from the sale of certain investment real estate assets in 2001. During the year, the Bank sold its mutual fund record keeping and custody business and recorded a pre-tax gain of $40 million. During fiscal 2001, the Bank sold certain investment real estate for a pre-tax gain on sale of $350 million, net of deferrals. The Bank has excluded these special gains in analyzing its performance as they are not recurring events. Reported other income was $4,929 million for 2002, a decrease of $1,518 million from 2001.
Trading income reported in other income decreased by $789 million in 2002, while trading related income generated by TD Securities – which is the total of trading income reported in other income and the net interest income on trading positions reported in net interest income – was $1,353 million for the year, a decrease of $184 million or 12% as compared with 2001. This was a solid performance given the decrease in market volatility, the continued slowdown in corporate origination activity and weak credit markets experienced during 2002. The investment securities portfolio realized net gains of only $26 million in 2002. This represents a significant decrease from net investment securities gains of $216 million in 2001. The decrease is primarily attributable to weaker equity markets leading to fewer exit opportunities. Overall, the equity investment securities portfolio continued to have a surplus over its book value of $228 million compared with $370 million at the end of 2001. The decline in other income also reflects a decrease in self-directed brokerage revenues of $80 million, or 8%, compared with 2001. This decrease reflects a 15% drop in average trades per day to 98,900 from 116,000 a year ago. Income from loan securitizations decreased by $54 million, or 20%, as compared with a year ago, as a result of lower levels of securitized assets. Partially offsetting this decline in other income was a year-over-year increase in insurance revenues of $49 million or 15%. Also contributing to the overall decline in other income was a decrease in property rental income of $52 million as the Bank sold substantially all of its investment real estate in fiscal 2001.
Reported other income was $6,447 million in 2001, an increase of $47 million, or .7%, from 2000. After excluding the special gains from the sale of certain investment real estate assets in 2001, other income was $6,097 million for the year, a decrease of $303 million or 5% from 2000. The decline in other income in 2001 reflects a significant decrease in self-directed brokerage revenues of $519 million or 34%. This decrease reflects a 38% drop in average trades per day to 116,000 in 2001 from 188,000 in 2000. In 2001, net investment securities gains decreased by $166 million or 43%. While trading income reported in other income increased by only $93 million or 8% in 2001, trading related income (including net interest income on trading securities) generated by TD Securities increased by $599 million or 64% to $1,537 million. In addition, retail banking was a strong contributor to other income in 2001. Insurance revenues reached $326 million, up $128 million or 65% from fiscal 2000. Card services, retail credit fees and service fees were up $159 million or 19%, reflecting growth in the business and a full year’s results for Canada Trust as compared with only nine months in 2000.

|