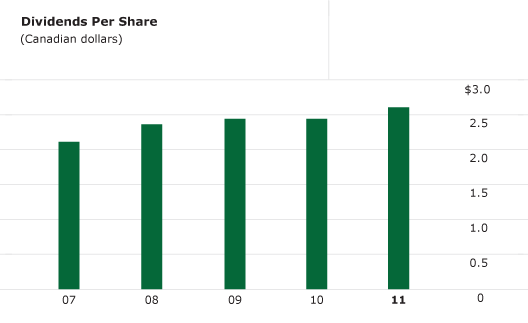
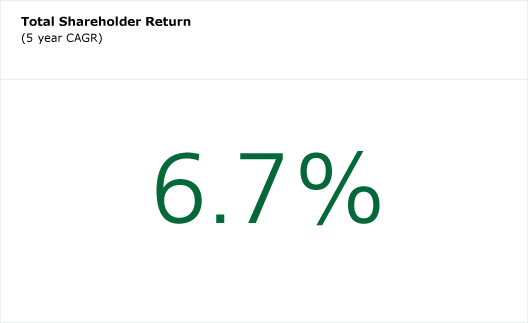
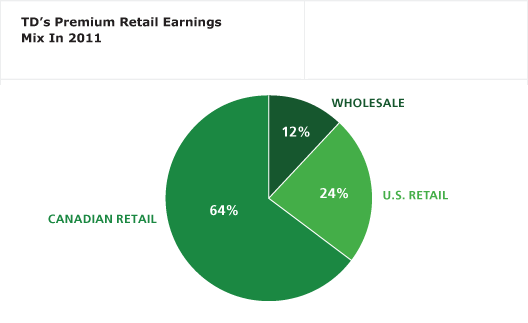
Year at a glance1
-
We’re proud of all we accomplished in business this year, from expanding our operational footprint to finding new ways to serve our customers and clients – and that’s just the beginning.
TD has the most popular mobile banking application in Canada
with more than 1 million downloads
TD Bank, America’s Most Convenient Bank®, reached earnings record
for the second year in a row, U.S. Personal & Commercial adjusted earnings surpassed the $1 billion mark
TD named Best Bank in North America
by Euromoney magazine for the third year in a row
TD continued to grow its ‘under-represented businesses’
acquired Chrysler Financial and MBNA Canada’s credit card portfolio in fiscal 2011
Our retail operations posted a record $5.7 billion
in adjusted earnings for 2011
Canadian Wealth Advice businesses hit milestone
$100 billion in assets under administration despite volatile markets
TD Securities maintained its top-three dealer status in Canada
#1 in equity underwriting and equity block trading; #2 in syndicated loans, corporate debt and M&A announced
TD Insurance’s total premiums exceeded $3 billion for the second consecutive year
#2 personal home and auto insurer in Canada
TD Canada Trust named Highest in Customer Satisfaction
among the Big Five Retail Banks for the sixth year in a row2
1 Results prepared in accordance with GAAP are referred to as "reported." Adjusted results (excluding "items of note," net of tax, from reported results) and related terms are not defined terms under GAAP and, therefore, may not be comparable to similar terms used by other issuers.
See "How the Bank Reports" in the accompanying Management’s Discussion and Analysis for further explanation, a list of the items of note and reconciliation of non-GAAP financial measures.
"Five-year CAGR" is the compound annual growth rate calculated from 2006 to 2011 on an adjusted basis.
"TD’s Premium Retail Earnings Mix" is based on adjusted results.
"Canadian Retail" earnings are the total adjusted earnings of the Canadian Personal and Commercial Banking and Wealth Management segments.
"U.S. Retail" earnings are the total adjusted earnings of U.S. Personal and Commercial Banking segment and AMTD pickup.
Canadian peers / Big Five Retail Banks include Royal Bank of Canada, Scotiabank, Bank of Montreal and Canadian Imperial Bank of Commerce.
U.S. peers include Citigroup, Bank of America, J.P. Morgan, Wells Fargo, PNC Financial and U.S. Bancorp.
For purposes of comparison with U.S. peers, dividends per share five-year compound growth rate is calculated on a year-to-date basis from Q3 2006 to Q3 2011.
2 TD Canada Trust ranks “Highest in customer satisfaction among the Big Five Retail Banks” – a study that looked at six major drivers of customer satisfaction. President’s Choice Financial received the highest numerical score among the midsize retail banks in the proprietary J.D. Power and Associates 2011 Canadian Retail Banking Customer Satisfaction StudySM. Study based on 12,740 total responses measuring eight banks. Proprietary study results are based on experiences and perceptions of consumers surveyed November 1, 2010 to October 31, 2011. Visit jdpower.com. -
A summary of our 2011 results and financial position tells TD’s high-level business story.
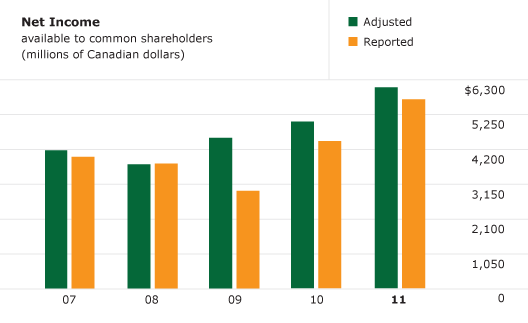
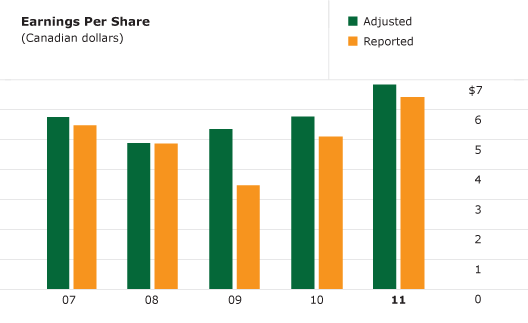
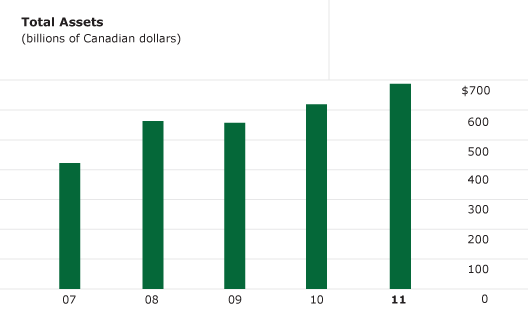
(millions of Canadian dollars, except where noted) 2011 2010 2009 Results of operations Total revenues - reported $ 21,594 $ 19,565 $ 17,860 Total revenues - adjusted 21,418 19,563 18,621 Net income - reported 5,889 4,644 3,120 Net income - adjusted 6,251 5,228 4,716 Financial positions at year end Total assets 686,360 619,545 557,219 Total deposits 481,114 429,971 391,034 Total loans 305,808 272,162 255,496 Per common share (Canadian dollars) Diluted earnings - reported 6.41 5.10 3.47 Diluted earnings - adjusted 6.82 5.77 5.35 Dividend payout ratio - adjusted 38.1% 42.1% 45.6% Closing market price 75.23 73.45 61.68 Total shareholder return 5.7% 23.4% 13.6% Financial ratios Tier 1 capital ratio 13.0% 12.2% 11.3% Total capital ratio 16.0% 15.5% 14.9% Efficiency ratio - reported 60.6% 62.2% 68.4% Efficiency ratio - adjusted 57.9% 58.6% 59.2%
1 Results prepared in accordance with GAAP are referred to as “reported.” Adjusted results (excluding “items of note,” net of tax, from reported results) and related terms are not defined terms under GAAP and, therefore, may not be comparable to similar terms used by other issuers.
See “How the Bank Reports” in the accompanying Management’s Discussion and Analysis for further explanation, a list of the items of note and reconciliation of non-GAAP financial measures.
“Five-year CAGR” is the compound annual growth rate calculated from 2006 to 2011 on an adjusted basis.
“TD’s Premium Retail Earnings Mix” is based on adjusted results.
“Canadian Retail” earnings are the total adjusted earnings of the Canadian Personal and Commercial Banking and Wealth Management segments.
“U.S. Retail” earnings are the total adjusted earnings of U.S. Personal and Commercial Banking segment and AMTD pickup.
Canadian peers / Big Five Retail Banks include Royal Bank of Canada, Scotiabank, Bank of Montreal and Canadian Imperial Bank of Commerce.
U.S. peers include Citigroup, Bank of America, J.P. Morgan, Wells Fargo, PNC Financial and U.S. Bancorp.
For purposes of comparison with U.S. peers, dividends per share five-year compound growth rate is calculated on a year-to-date basis from Q3 2006 to Q3 2011. -
Performance indicators focus effort, communicate our priorities and benchmark TD’s performance as we strive to be The Better Bank. The following table highlights our performance against these indicators.
2011 performance indicators Results2 Financial - Deliver above-peer-average total shareholder return3
- Grow adjusted earnings per share (EPS) by 7 to 10%
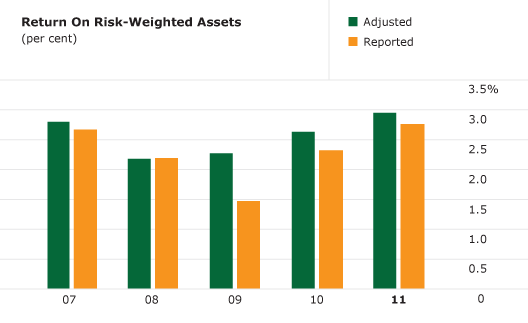
- Deliver above-peer-average return on risk-weighted assets
- TD return: 5.7% vs. Canadian peer average of -1.2%
- 18% adjusted EPS growth
- TD return: 2.95% vs. Canadian peer average of 2.30%
Business operations - Grow revenue faster than expenses
- Invest in core businesses to enhance customer experience
- Revenue growth exceeded expense growth by 1.4%
- Refer to “Business Segment Analysis” in the accompanying MD&A for details
Customer - Improve Customer Experience Index (CEI)4 scores
- Invest in core businesses to enhance customer experience
- CEI score 30.4% (target 26.7%)
- Refer to “Business Segment Analysis” in the accompanying MD&A for details
Employee - Improve employee engagement score year-over-year
- Enhance the employee experience by:
- Listening to our employees
- Building employment diversity
- Providing a healthy, safe and flexible work environment
- Providing competitive pay, benefits and performance-based compensation
- Investing in training and development
- Employee engagement score5 was 4.18 in fall 2011 vs. 4.15 in fall 2010
- See TD’s 2011 Corporate Responsibility Report available March 2012
Community - Donate minimum of 1% of domestic pre-tax profits (five-year average) to charitable and not-for-profit organizations
- Make positive contributions by:
- Supporting employees’ community involvement and fundraising efforts
- Supporting advancements in our areas of focus, which include education and financial literacy, creating opportunities for young people, creating opportunities for affordable housing and the environment
- Protecting and preserving the environment
- 1.3%6 or $42.6 million, in donations and community sponsorships in Canada vs. 1.4% or $38.4 million, in 2010
- US$25 million in donations and community sponsorships in the U.S. vs. US$19.8 million in 2010
- £73,857 in donations and community sponsorships in the U.K. vs. £90,919 in 2010
- $377,500 in domestic employee volunteer grants to 580+ organizations
- $23 million, or 56% of our community giving, was directed to promote our areas of focus domestically
- $3.6 million distributed to 1,085 community environmental projects through TD Friends of the Environment Foundation; an additional $4.7 million from TD‘s community giving budget was used to support environmental projects7
1 See footnote 1 under the Highlights section.
2 Performance indicators that include an earnings component are based on TD’s full-year adjusted results (except as noted) as explained in “How the Bank Reports” in the accompanying MD&A. For peers, earnings have been adjusted on a comparable basis to exclude identified non-underlying items.
3 Total shareholder return is measured on a one-year basis from November 1, 2010, to October 31, 2011
4 CEI is a measurement program that tracks TD customers’ loyalty and advocacy.
5 Scale for employee engagement score is from one to five.
6 Calculated based on Canadian Cash Donations/five-year rolling average domestic NIBT.
7 Excludes a special one-time donations of $1MM from TD Environment to TD FEF for paper neutral initiative.


