
Charts and Graphs - Employees
Employee Population By Location
| Canadian Employees as of October 31.2009 | |||
| Province/State Name | Part-time/Casual | Full time | Total |
| Alberta | 1501 | 2782 | 4283 |
| British Columbia | 1602 | 2944 | 4546 |
| Manitoba | 239 | 424 | 663 |
| New Brunswick | 101 | 180 | 281 |
| Newfoundland | 51 | 94 | 145 |
| Northwest Territories | 2 | 10 | 12 |
| Nova Scotia | 144 | 353 | 497 |
| Ontario | 8444 | 28824 | 37268 |
| Prince Edward Island | 21 | 46 | 67 |
| Quebec | 872 | 2226 | 3098 |
| Saskatchewan | 240 | 330 | 570 |
| Yukon | 9 | 22 | 31 |
| Grand Total | 13226 | 38235 | 51461 |
| International Employees | |||
| International | 901 | ||
| USA | 22893 | ||
| * TD Waterhouse UK and Wholesale Banking in Europe and Asia-Pacific | |||
| Total Global TDBFG | 75,255 | ||
CANADIAN EMPLOYEES AGE PROFILE
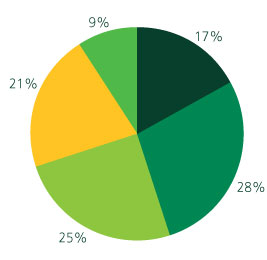
- • 0-25 yrs
- • 26-34
- • 35-44
- • 45-54
- • 55+
U.S. EMPLOYEES AGE PROFILE
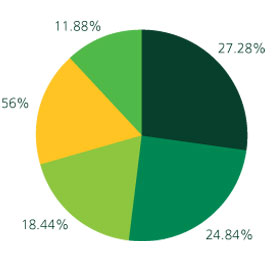
- • 0-25 yrs
- • 26-34
- • 35-44
- • 45-54
- • 55+
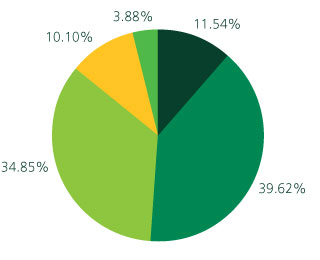
INTERNATIONAL EMPLOYEES AGE PROFILE
 |
|
|
|
|

The document you requested cannot be found. It may have been moved or deleted, or you may have typed its location incorrectly. Click one of the links below to access our site.
You may also wish to update your bookmarks to our site at this time.

Le document demandé est introuvable. Il a peut-être été déplacé ou supprimé, ou vous avez peut-être incorrectement tapé son emplacement. Cliquez sur l'un des liens indiqués ci-dessous pour accéder à notre site.
N'oubliez pas de mettre votre signet de notre site à jour dès maintenant.
|
|||||
