Year at a glance
Colleen Johnston, Group Head Finance, Sourcing and Corporate Communications, and Chief Financial Officer, TD Bank Group
NET INCOME1
available to common shareholders
(millions of Canadian dollars)
 Adjusted
  Reported
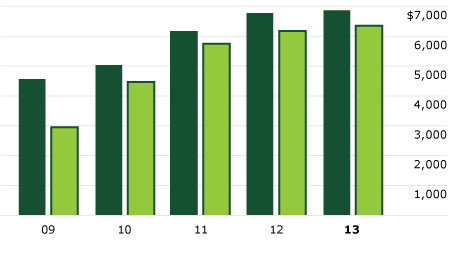
12.8% TD’s 5-year CAGR (adjusted)3
DILUTED EARNINGS PER SHARE1
(Canadian dollars)
 Adjusted
  Reported
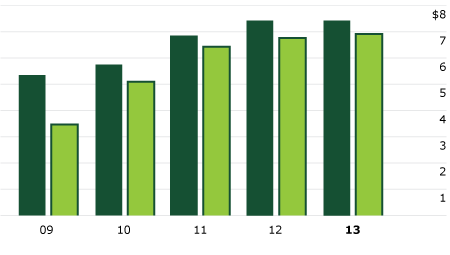
8.8% TD’s 5-year CAGR (adjusted)3
RETURN ON RISK-WEIGHTED ASSETS1,2
(per cent)
 Adjusted
  Reported
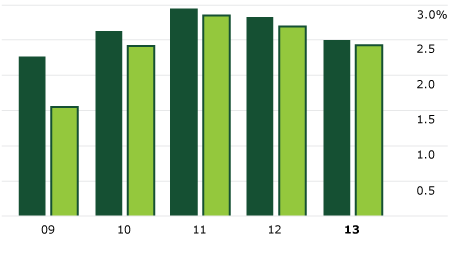
2.50% TD’s 2013 return on risk-weighted assets (adjusted)
TOTAL ASSETS1
(billions of Canadian dollars)
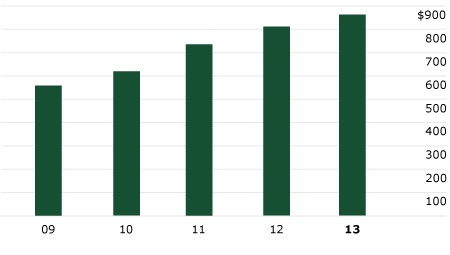
$863 billion of total assets at Oct. 31, 2013
DIVIDENDS PER SHARE
(Canadian dollars)
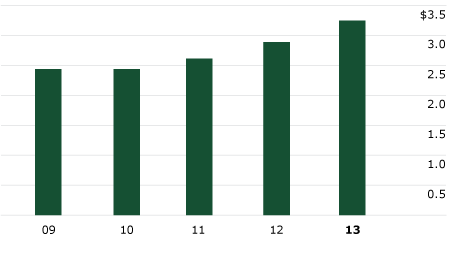
6.5% TD’s 5-year CAGR3
3.0% Canadian peers 5-year CAGR3,4
(22.2)% U.S. peers 5-year CAGR3,5
TOTAL SHAREHOLDER RETURN
(5-year CAGR)3
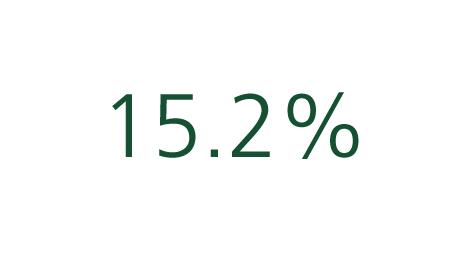
14.9% Canadian peers4
(0.6)% U.S. peers5
TD’S PREMIUM RETAIL EARNINGS MIX6
TD’s premium earnings mix is built on a North American retail focus – a lower-risk business with consistent earnings.
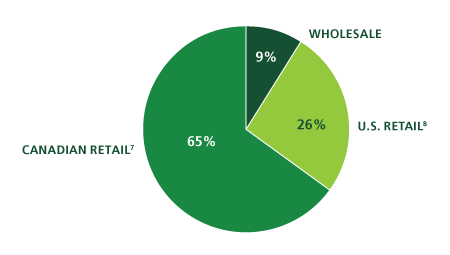
91% Retail
9% Wholesale
1 Effective November 1, 2011, The Toronto-Dominion Bank (the "Bank" or "TD") prepares its consolidated financial statements in accordance with International Financial Reporting Standards (IFRS), the current generally accepted accounting principles (GAAP), and refers to results prepared in accordance with IFRS as the ”reported” results. The Bank also utilizes non-GAAP financial measures to arrive at “adjusted” results (i.e. reported results excluding “items of note”, net of income taxes) to assess each of its businesses and measure overall Bank performance. See “How the Bank Reports” in the accompanying Management’s Discussion and Analysis (MD&A) for further explanation, a list of the items of note and a reconciliation of non-GAAP financial measures. The Bank’s financial results for fiscal 2011 have been presented in accordance with IFRS for comparative purposes in the Bank’s 2013 Annual Consolidated Financial Statements and MD&A (unless otherwise noted). Accordingly, the calculation of growth rates include balances in accordance with Canadian GAAP for the 2009 to 2010 financial years and balances in accordance with IFRS for 2011 to 2013.
2 Effective 2013, amounts are calculated in accordance with the Basel III regulatory framework, and are presented based on the “all-in” methodology. Prior to 2013, amounts were calculated in accordance with the Basel II regulatory framework. Prior to 2012, amounts were based on Canadian GAAP.
3 “Five-year CAGR” is the compound annual growth rate calculated from 2008 to 2013 on an adjusted basis.
4 Canadian peers include Royal Bank of Canada, Scotiabank, Bank of Montreal and Canadian Imperial Bank of Commerce.
5 U.S. peers include Citigroup, Bank of America, J.P. Morgan, Wells Fargo, PNC Financial and U.S. Bancorp.
6 "TD's Premium Retail Earnings Mix" is based on adjusted results. See footnote 1 for how the Bank calculates adjusted results.
7 "Canadian Retail" earnings are the total adjusted earnings of the Canadian Personal and Commercial Banking and Wealth and Insurance segments excluding the TD Ameritrade Holding Corporation pickup.
8 "U.S. Retail" earnings are the total adjusted earnings of U.S. Personal and Commercial Banking segment and TD Ameritrade Holding Corporation pickup.
