
Year at a glance
Colleen Johnston, Group Head Finance, Sourcing and Corporate Communications, and Chief Financial Officer, TD Bank Group
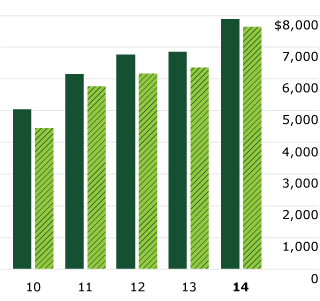
TD Bank Group closed 2014 with another new high - $8.1 billion in adjusted earnings, reflecting great execution and contributions by all of our business lines.
NET INCOME1
available to common shareholders
(millions of Canadian dollars)
 Adjusted Reported
11.6% TD’s 5-year CAGR (adjusted)3
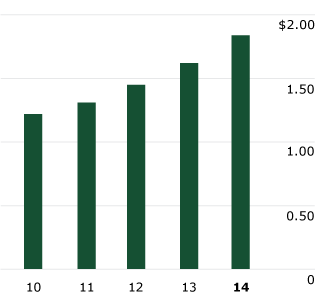
DILUTED EARNINGS PER SHARE1
(Canadian dollars)
Adjusted Reported
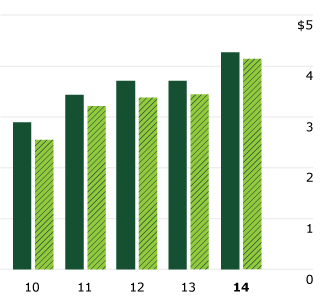
9.8% TD’s 5-year CAGR (adjusted)3
RETURN ON RISK-WEIGHTED ASSETS1,2
(percent)
Adjusted Reported
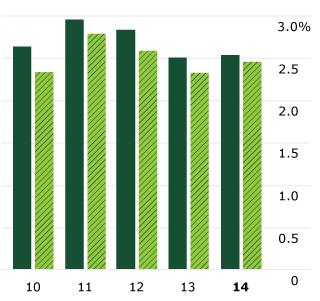
2.53% TD’s 2014 return on Common Equity Tier 1 Capital risk-weighted assets (adjusted)
TOTAL ASSETS1
(billions of Canadian dollars)
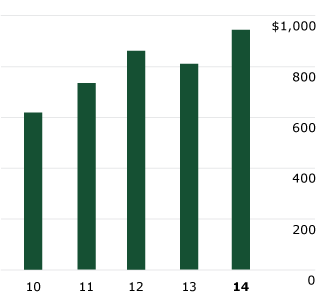
$945 billion of total assets at October 31, 2014
DIVIDENDS PER SHARE
(Canadian dollars)
8.6% TD’s 5-year CAGR3
4.2% Canadian peers 5-year CAGR3,4
TOTAL SHAREHOLDER RETURN
(5-year CAGR)3, 5
14.2% Canadian peers4,5
TD’S PREMIUM RETAIL EARNINGS MIX6
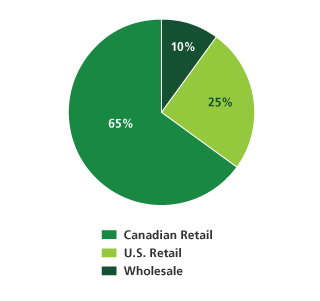
90% Retail
10% Wholesale
TD’s premium earnings mix is built on a North American retail focus – a lower-risk business with consistent earnings.
1 Effective November 1, 2011, The Toronto-Dominion Bank (the “Bank” or “TD”) prepares its Consolidated Financial Statements in accordance with International Financial Reporting Standards (IFRS), the current Generally Accepted Accounting Principles (GAAP), and refers to results prepared in accordance with IFRS as the ”reported” results. The Bank also utilizes non-GAAP financial measures to arrive at “adjusted” results to assess each of its businesses and to measure overall Bank performance. To arrive at adjusted results, the Bank removes “items of note”, net of income taxes, from reported results. See “How the Bank Reports” in the accompanying 2014 Management’s Discussion and Analysis (MD&A) for further explanation, a list of the items of note, and a reconciliation of non-GAAP financial measures. Based on Canadian Generally Accepted Accounting Principles for 2010 and International Financial Reporting Standards (IFRS) as issued by the International Accounting Standards Board (IASB) from 2011 to 2014.
Certain comparative amounts have been restated as a result of the adoption of new and amended standards under IFRS (New IFRS Standards and Amendments) which required retrospective application and to retrospectively reflect the impact of the January 31, 2014, stock dividend, as further discussed in Note 4 and Note 21 of the 2014 Consolidated Financial Statements, respectively, and due to reclassifications to conform with the presentation adopted in the current period. In addition, the Bank’s comparative segment results have been restated to reflect the segment realignment which occurred on November 1, 2013, which is further discussed in Note 31 of the 2014 Consolidated Financial Statements.
2 Effective 2013, amounts are calculated in accordance with the Basel III regulatory framework, and are presented on the “all-in” methodology. Prior to 2013, amounts were calculated in accordance with the Basel II regulatory framework.
3 “Five-year CAGR” is the compound annual growth rate calculated from 2009 to 2014 on an adjusted basis. The calculation of growth rates include balances in accordance with Canadian Generally Accepted Accounting Principles for the 2010 financial year and balances in accordance with IFRS for 2011 to 2014.
4 Canadian peers include Royal Bank of Canada, Scotiabank, Bank of Montreal and Canadian Imperial Bank of Commerce.
5 Total Shareholder Return based on Bloomberg for the five-year period ending October 31, 2014.
6 “TD’s Premium Retail Earnings Mix” is based on adjusted results and excludes Corporate segment.