Greenhouse Gas Emissions
-
- Greenhouse Gas Emissions
- Performance
-
Our Approach
In 2010 TD’s global business operations became carbon-neutral, going beyond our original commitment which included only our Canadian operations. The value of moving the organization toward carbon-neutrality was clear from the start. It raised awareness of energy usage among our employees, enabled us to reduce our operating costs and provided an opportunity to develop new products to meet growing consumer demand.
We based our carbon-neutral requirements on our greenhouse gas emissions identified in our 2009 Greenhouse Gas inventory. This measures emissions from TD’s wholly-owned North American operations. In addition we estimated emissions from our operations outside of North America, based on the space occupied.
We achieved carbon neutrality by reducing energy usage, purchasing renewable energy and developing innovative high-quality carbon offsets.
Our Plan to Achieve Carbon Neutrality What we said we would do: Step 1: Reduce Reduce greenhouse gas emissions through energy reductions by 5%. Step 2: Green our Energy Supply Purchase renewable energy equivalent to 20% of our greenhouse gas emissions. Step 3: Carbon Offsets Purchase and develop high quality local carbon offsets with social benefits.
For a detailed breakdown of our carbon neutral program please see the Carbon Neutral Schedule.
Renewable Energy
TD Bank was recognized by the U.S. Environmental Protection Agency as a Green Power Leader. 1
In 2010 we purchased renewable energy credits equivalent to 51% of the electricity demand of our global operations. All of the electricity for our U.S. operations, including our ABM network, is supplied by renewable energy. This amounts to more than 240 million kilowatt hours of green power every year. According to the Environmental Protection Agency, this amount of electricity is equivalent to avoiding the carbon dioxide (CO2) emissions of more than 33,000 passenger vehicles per year.
In Canada, our ABM network, and all of our business operations in B.C., Alberta, Saskatchewan, Nova Scotia and P.E.I are powered by renewable energy. We selected these provinces because they have the strongest reliance on fossil fuel sources for electricity. By purchasing renewables as an alternate energy source, we were able to remove the greatest amount of carbon from our electricity supply.
Through this initiative, we also learned about the renewable energy markets and applied that knowledge to develop:
- A new design standard for branches that includes rooftop solar panels; and
- A set of renewables financing products for residential, business and agricultural customers.
Developing Innovative, High-Quality Carbon Offsets
No matter how hard we work to reduce energy use and green our electricity supply, we will continue to emit some greenhouse gases through our business operations. We’re committed to developing high-quality offsets within our North American geographical footprint. In 2010, TD purchased offsets to account for 41% of our carbon footprint. All of our offsets were independently verified through ClimateCHECK Corporation.
About half of the offsets were developed in collaboration with not-for-profit partners. We worked with a number of social partners to develop new and innovative carbon offset protocols that will provide revenue and new jobs in the green economy.
Developing Carbon Offsets with Social Benefits
This year, we supported a unique partnership with the Munsee-Delaware First Nation in southwestern Ontario and Tree Canada to develop the first forest plantation dedicated to sequestering carbon. Munsee-Delaware First Nation provided the land and the people to plant trees. Tree Canada developed a carbon protocol that allows TD to use the sequestered carbon as an offset. To help maximize the carbon captured, we selected a hybrid poplar tree, developed from native species by the University of Guelph, which grows quickly and has a high rate of carbon sequestration.
Results:
- 77,000 fast-growing hardwood trees were planted on 48 hectares on the Munsee-Delaware First Nation land.
- During their 31 years of growth, the trees are expected to sequester 20,000 tonnes of carbon dioxide, after which they will be harvested for biofuel production.
- The carbon captured over the lifetime of the forest, along with the replacement of conventional fuel with the biofuel produced by the forest, will further reduce emissions of carbon dioxide in the atmosphere.
Chief Patrick Waddilove of the Munsee-Delaware First Nation sees other benefits to the carbon forest – it will help create jobs and a sustainable industry for the First Nation, which holds strong environmental values. “We’ve created a new company, called Munsee Tree, and our workforce will be our young people,” says Waddilove. “Forty-two youth are already employed planting the trees, and a green technology certificate program is being developed with Fanshawe College.”
1 TD Bank received a 2010 Green Power Leadership Award from the U.S. Environmental Protection Agency (EPA).
-
TD measures our direct emissions from heating and cooling (Scope 1), our indirect emissions from electricity (Scope 2) and our business travel emissions (Scope 3) from our wholly-owned North American operations, based on the Greenhouse Gas Protocol (GHG Protocol). In 2010, Ernst & Young LLP performed a reasonable assurance engagement over TD's 2009 Greenhouse Gas Inventory and our carbon-neutral schedule. The results of Ernst & Young's assurance engagements are documented in their assurance statement which can be found here.
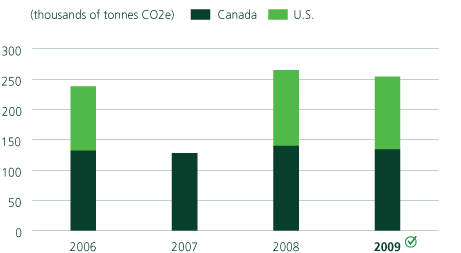
Total Greenhouse Gas Emissions1

20092 
2008 2007 2006 (baseline) Canadian Operations (tonnes CO2e) 133,702 139,795 127,658 131,8542 
U.S. Operations Total Greenhouse Gas Emissions (tonnes CO2e) 119,556 124,575 106,443 TOTAL 253,258 264,370 238,297
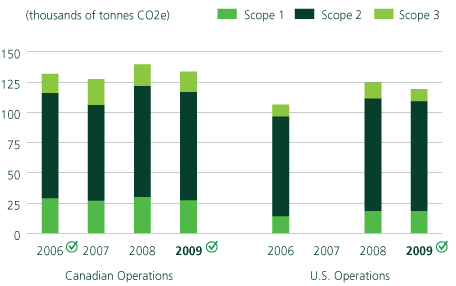
Detailed Emissions Breakdown1

(tonnes CO2e) 20092 
2008 2007 2006 (baseline) Canadian 133,702 139,795 127,658 131,8542 
Scope 1 27,322 30,005 26,901 28,916 Scope 2 89,517 91,601 79,195 86,988 Scope 3 16,863 18,189 21,562 15,950 U.S. Operations 119,556 124,575 106,443 Scope 1 18,394 18,534 14,054 Scope 2 90,977 92,805 82,509 Scope 3 10,185 13,236 9,879
1 For further details see accompanying notes.
2 2009 Canadian and U.S. results and 2006 Canadian results have been audited by Ernst & Young LLP.TD’s energy reduction program for our Canadian operations has been in place since 2007. Despite a 30% growth in employee population, the increase in GHG emissions rose only 1.4% between 2006 and 2009. Emissions from electricity have been reduced by 5.5% between 2006 and 2009.
We established a baseline for our U.S. operations in 2006. In 2007 there was significant change due to the acquisition of Commerce Bank and consolidation of our facilities; and we did not see value in measuring our emissions for that year. The emissions from 2008 onward reflect our integrated U.S. operations.
The reductions observed in our U.S. operations in 2009 relative to 2008 are largely due to revised electrical power grid emission factors, which were published in 2009. These reflect increased use of renewables within electricity supplied by state utilities.


